
It's five years since we installed our solar PV system (a 1.1 kW Kaneka thin film grid connect system). Ever since then our goal has been to generate more power than we consume and after four years of achieving this we have not met our goal this year. The pattern of usage and generation was very similar to past years, with higher consumption and lower generation in winter, transitioning into higher generation and lower consumption in the warmer months.


We came pretty close to our goal, generating just 44 kWh less than we consumed (about 10 days worth of generation). Although we took a lot from the grid, we also fed in three quarters of the power we generated to the grid. We are lucky enough to qualify for the 48c feed in tariff (FIT) so this makes our bill really low (a credit of $67!). If we didn't have solar panels (BAU, business as usual) our power bill this year would be $552 which means we saved $619 this year. Since our panels cost around $6,000 five years ago this means the payback time will be roughly ten years, which isn't too bad considering we should get another 15-30 years life out of them. We saved a grand total of 46 cents with smart power this year. This is a system whereby you pay different tariffs depending on the time of day you take power from the grid. There is very little point in having it now if you get the FIT but we'd need to pay $60 to remove it so there's no point right now.
| kWh generated | kWh taken from grid | kWh fed into grid | kWh used | Average daily usage (kWh) | Average daily generation (kWh) | Year 5 bill | BAU bill | $ saved with smart power | % of power generated fed to grid |
| 1619 | 1281 | 1237 | 1663 | 4.57 | 4.45 | -$67.34 | $551.89 | $0.46 | 76.4 |
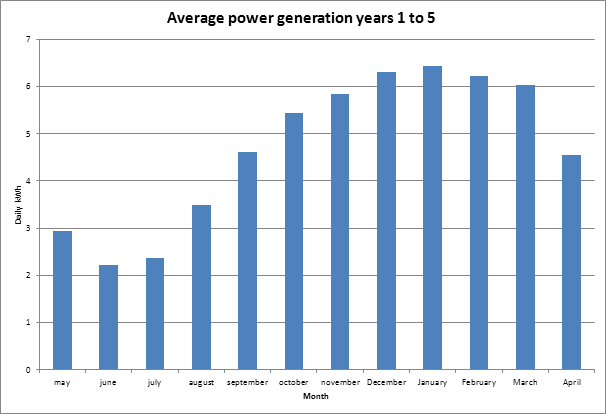
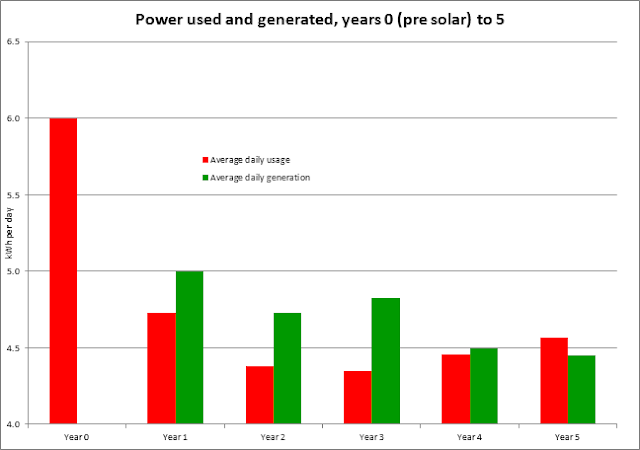
So why did we use more power than we generated this year? There are a few reasons. As solar panels age their production tends to drop off slightly and this is one of the reasons we didn't meet our goal this year. The chart below shows our average daily generation and usage in the last six years. Our generation has gone from 5 kWh in year 1 to 4.7, 4.8, 4.5 and 4.45 in subsequent years. As a matter of interest here are the average daily amounts of power generated by our system each month over the last five years. Being in the southern hemisphere means our summer is December to February and this is when we generate the most. Spring is the next best season, then autumn and winter last. The main reason for this is the number of sunny hours per day which is highest in summer. Perth has a mediterranean climate, with hot dry summers and cool, wet winters. This means that winter days are often cloudy which leads to low solar radiation (and they're also shorter of course). PV panels actually perform at lower efficiency above 26C, which we regularly get in summer. So this means that the longer and sunnier days in summer more than make up for the lower efficiency of the panels in high temperatures. We also get some shading of our panels in winter, which helps explain why June and July are so bad.

Our usage has gone from 6 kWh in year 0 (before we went solar) to 4.7, 4.4, 4.3, 4.5 and 4.6 in subsequent years. We've done really well in past years to use less power despite adding new power users (eg solar hot water booster, rain water tank pump, electric bike charging) but this year we simply couldn't do it. We bought another electric bike (the Fr8) and recently installed a grey water system which uses a small amount of power to pump the water out. These two additions coupled with lower generation this year made it too hard a task. We still did very well considering the average usage for WA is around 18 kWh a day, four times what we used.

But never mind, we're hoping to turn this around next year. Our 15 year old washing machine just died so we've bought a new super efficient front loader to replace it. This may make the difference next year so watch this space.
This is very interesting and I must congratulate you for the way you have presented the figures and of course your minimal usage. Here in my Province of Manitoba in Canada we have no feed in tariff - and in fact the electricity company pays LESS for feed in than they charge because they make no allowances for the taxes. Our electric company is spending billions building new hydroelectric dams hundreds of miles away in the north with all the pylons and wires etc to deliver it to the south. And then they sell the electricity to the USA for about 3c/kwh. Stupid when we could generate our own and save the need for dams, flooding and all the infrastructure.
ReplyDeleteThank you.
Thank you for such as interesting article. We are the best solar power installation and repair companies at competitive prices in Perth, WA. Click here for more information:
ReplyDeleteSolar PV System Installation Services in Perth, WA
Photovoltaic Panels Price in Perth, WA